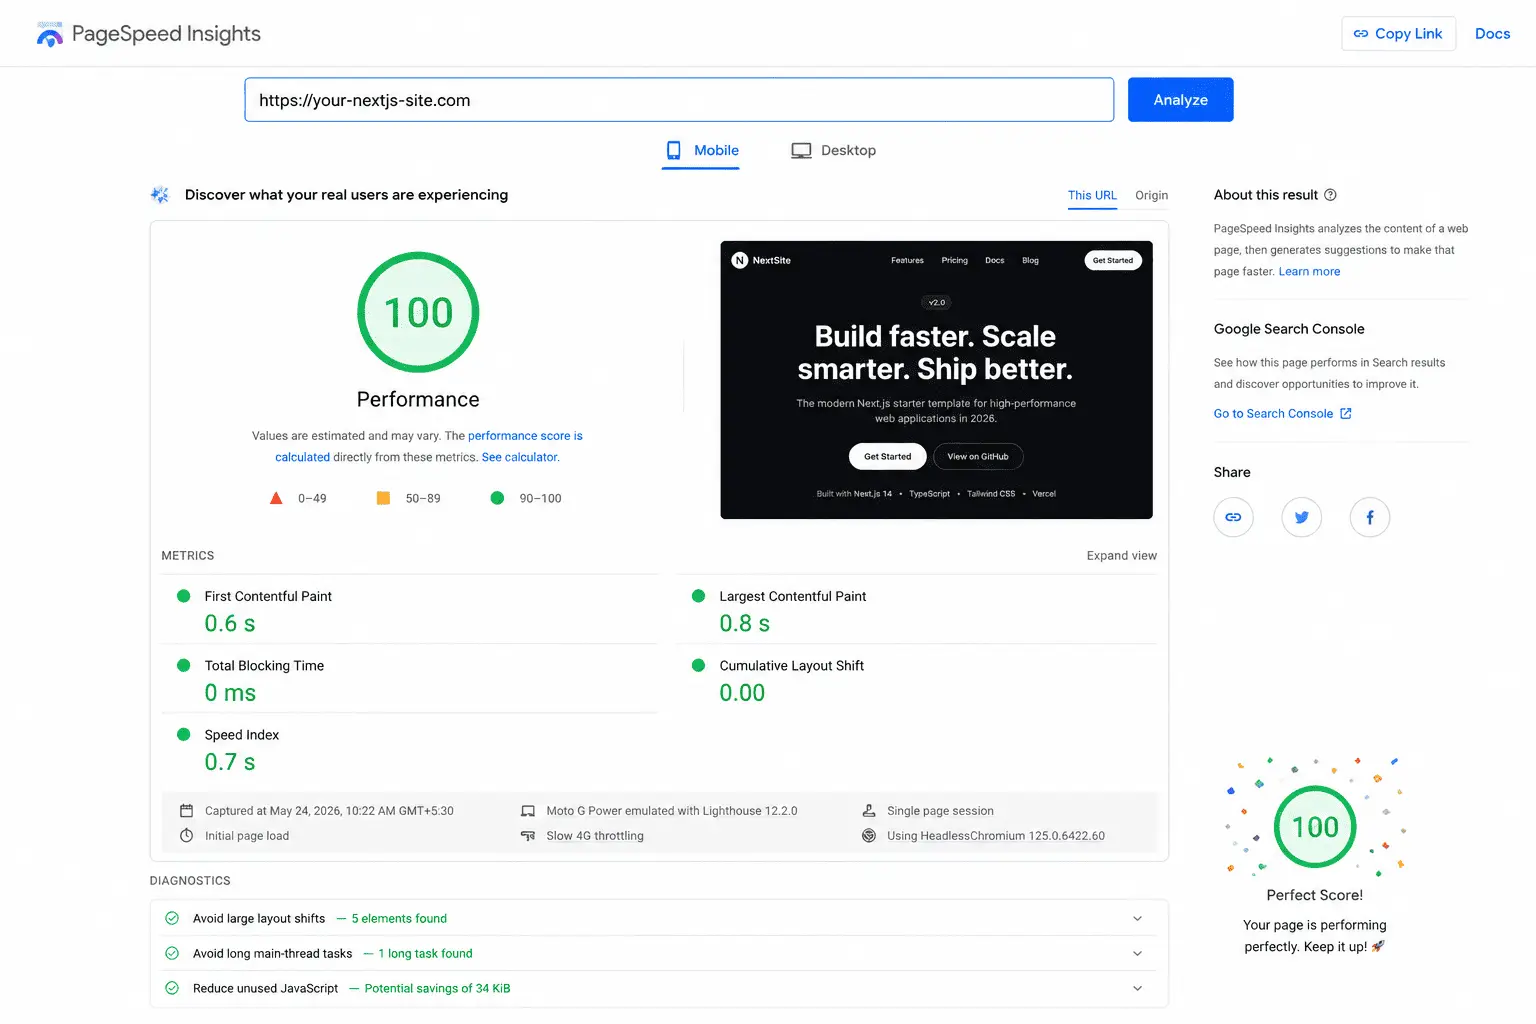
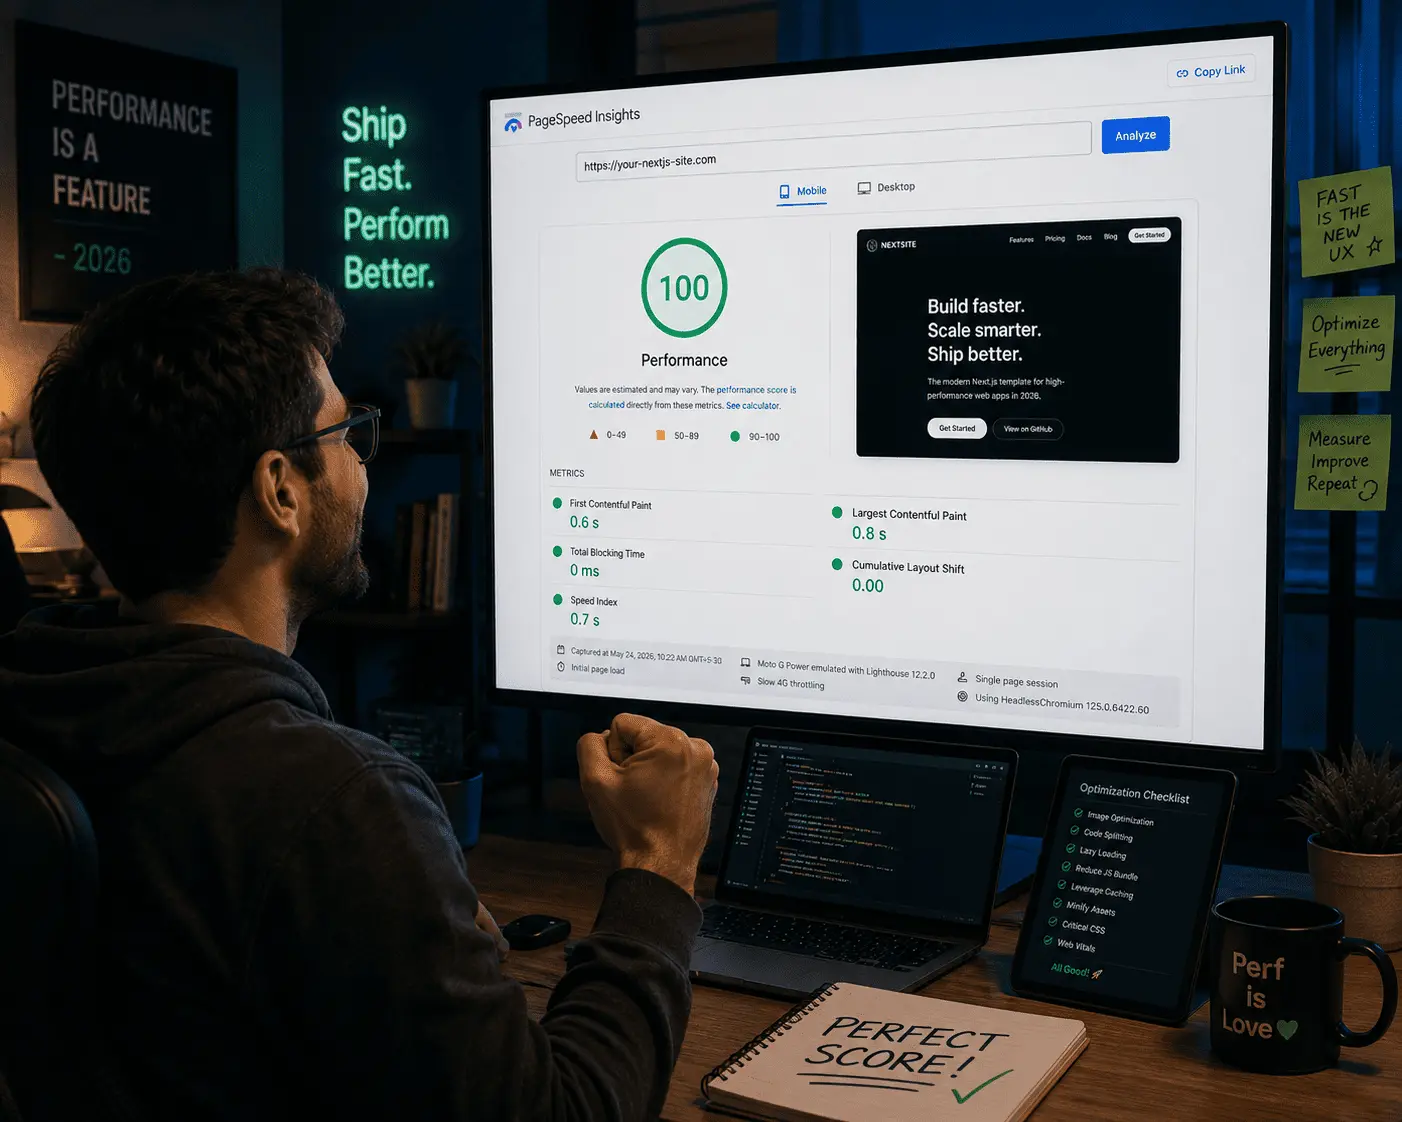
I stared at a Lighthouse score of 61 for longer than I’d like to admit. My Next.js blog looked sharp. The code was clean. TypeScript was happy. But PageSpeed Insights told a different story: a 4.3-second Largest Contentful Paint, a layout shift every time fonts loaded, and a JavaScript bundle large enough to embarrass me in front of strangers.
Six weeks later, after working through the problem methodically images, fonts, scripts, bundle size, caching headers, Core Web Vitals one at a time I hit the number every developer secretly wants to screenshot and post: 100/100 on Google PageSpeed Insights, both mobile and desktop.
This article is the guide I wish had existed when I started. Every fix is covered in order of impact, with the actual code I used. A Next.js PageSpeed 100 score is not magic. It is a series of deliberate, stackable decisions and every single one of them is available to you right now.
⚡ Who this is for: Developers with an existing Next.js site scoring below 90 who want a practical, step-by-step playbook. Code examples use the Next.js App Router (v14/v15). Pages Router equivalents are noted where they differ.
Where I Started: The 61/100 Problem
Before you can fix anything, you need to understand what is actually slow. I ran a cold Lighthouse audit on my blog’s homepage and the results gave me a clear picture of the problems. Here is exactly what the audit showed:
| Metric | Current Value | Status | Target / Note |
|---|---|---|---|
| Performance | 61 | Needs Improvement | Starting score |
| LCP (Largest Contentful Paint) | 4.3s | Amber | Target: < 2.5s |
| FCP (First Contentful Paint) | 1.8s | At Boundary | Target: < 1.8s |
| CLS (Cumulative Layout Shift) | 0.18 | Amber | Target: < 0.1 |
| INP (Interaction to Next Paint) | 380ms | Amber | Target: < 200ms |
| TTFB (Time to First Byte) | 620ms | Amber | Target: < 600ms |
Three culprits caused the majority of the score penalty: unoptimized images loaded eagerly above the fold, a Google Fonts <link> tag blocking the render, and third-party analytics scripts loading on the main thread before the page was interactive. Fix those three things and you get to the 80s. Everything else gets you to 100.
STEP 1
Fix Your Images First Critical Impact
Images are the single biggest PageSpeed killer in almost every Next.js blog. The good news: Next.js ships a purpose-built solution that handles the hardest parts automatically.
Switch Every <img> to <Image>
The next/image component does four things automatically that a plain <img> tag does not: it converts images to WebP or AVIF format (30–50% smaller than JPEG/PNG), implements lazy loading by default, enforces correct sizing to prevent CLS, and generates responsive srcset attributes automatically.
// ❌ Before plain img tag, PNG, eager, no dimensions
<img src="/blog/hero.png" alt="Blog hero image" />

// ✅ After next/image, WebP auto-converted, lazy by default
import Image from 'next/image'

<Image
  src="/blog/hero.png"
  alt="Blog hero image"
  width={820}
  height={450}
  sizes="(max-width: 768px) 100vw, 820px"
/>
Prioritize Your LCP Image
The LCP image usually your hero image or the first post card must not be lazy-loaded. Add priority to tell Next.js to preload it. This alone dropped my LCP from 4.3s to 2.8s.
// Add priority to your above-the-fold hero image only
<Image
  src="/blog/hero.png"
  alt="Next.js PageSpeed optimization guide hero"
  width={820}
  height={450}
  priority           // ← generates <link rel="preload"> in <head>
  sizes="(max-width: 768px) 100vw, 820px"
/>

// All other images: leave priority off (lazy is the default)
Set Explicit Dimensions to Eliminate CLS
Every image without explicit width and height causes layout shift (CLS) as the browser reserves no space before the image loads. If you’re pulling images from a CMS and dimensions are unknown, use fill with a wrapper div instead.
// For dynamic images with unknown dimensions (CMS images)
<div style={{ position: 'relative', width: '100%', aspectRatio: '16/9' }}>
  <Image
    src={post.coverImage}
    alt={post.title}
    fill
    style={{ objectFit: 'cover' }}
    sizes="(max-width: 768px) 100vw, 820px"
  />
</div>
❌ BeforePNG images, no dimensions, eager loading everywhere, LCP: 4.3s, CLS: 0.18
✅ AfterWebP auto-converted, priority on LCP only, explicit sizes, LCP: 1.9s, CLS: 0.02
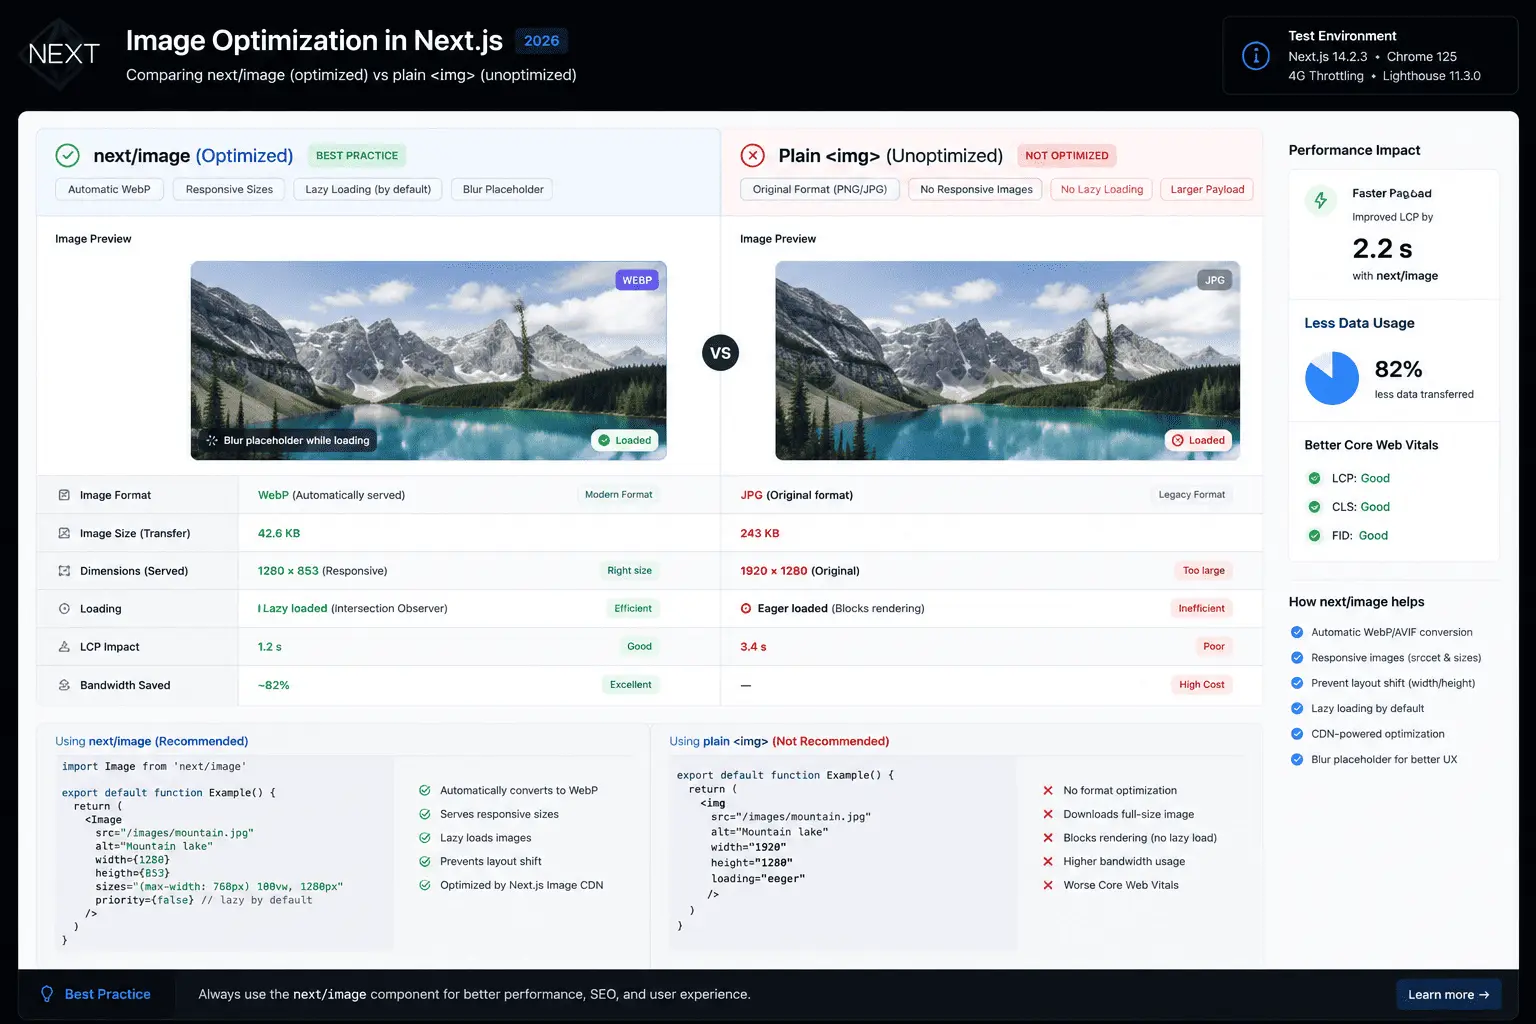
Switching from plain <img> to next/image converts images to WebP, adds responsive srcsets, and implements lazy loading in one component change.
STEP 2
Eliminate Font Layout Shift with next/font Critical Impact
Fonts were responsible for my 0.18 CLS score. The pattern is always the same: you load a Google Font via a <link> tag in your layout, the page renders in the fallback system font, and then jumps visually when the web font arrives. Every user sees it. Lighthouse penalises it heavily.
The fix is next/font Next.js’s built-in font optimization system. It downloads fonts at build time, hosts them alongside your app (no Google Fonts request at runtime), and automatically generates a CSS size-adjust fallback that makes the system font match the web font metrics exactly. The layout shift disappears because the fallback and the final font are visually identical.
app/layout.tsx

// ❌ Before Google Fonts link tag, blocks render, causes CLS
// <link href="https://fonts.googleapis.com/css2?family=Inter:wght@400;700&display=swap" rel="stylesheet" />

// ✅ After next/font, zero CLS, zero external request
import { Inter, Lora } from 'next/font/google'

const inter = Inter({
  subsets: ['latin'],
  display: 'swap',
  variable: '--font-inter',
})

const lora = Lora({
  subsets: ['latin'],
  weight: ['400', '700'],
  display: 'swap',
  variable: '--font-lora',
})

export default function RootLayout({ children }) {
  return (
    <html lang="en" className={`${inter.variable} ${lora.variable}`}>
      <body>{children}</body>
    </html>
  )
}
⚠️ Don’t do both. If you’re using next/font and still have a Google Fonts <link> in your layout or _document.tsx, you’re loading the font twice. Remove the link tag completely next/font replaces it entirely.
For Local Fonts (Self-Hosted)
import localFont from 'next/font/local'

const customFont = localFont({
  src: [
    { path: '../public/fonts/MyFont-Regular.woff2', weight: '400' },
    { path: '../public/fonts/MyFont-Bold.woff2',    weight: '700' },
  ],
  display: 'swap',
  variable: '--font-custom',
})
❌ BeforeGoogle Fonts <link> tag, external DNS lookup + download, CLS: 0.18, render-blocking
✅ Afternext/font, fonts served from same domain, size-adjust fallback, CLS: 0.00
STEP 3
Stop Third-Party Scripts Blocking Your Page Critical Impact
This was my most surprising finding: Google Analytics a Google product was one of the largest reasons my Google PageSpeed score was low. The Google Tag Manager script, even when loaded asynchronously, occupies the browser’s main thread and delays Next.js’s own rendering code by 100–200ms. Add any other third-party scripts (chat widgets, heatmaps, cookie banners) and the impact compounds.
The solution is Next.js’s built-in <Script> component with strategic loading strategies.
The Four Script Loading Strategies
| Strategy | When It Loads | Use Case |
|---|---|---|
beforeInteractive | Before page hydration | Critical polyfills only use sparingly |
afterInteractive | After hydration (default) | Tag Manager, analytics that need user context |
lazyOnload | During browser idle time | Chat widgets, social embeds, cookie banners |
worker | Web Worker thread | Heavy scripts keeps main thread free |
app/layout.tsx

import Script from 'next/script'

// ❌ Before inline script tag in <head>, blocks rendering
// <script async src="https://www.googletagmanager.com/gtag/js?id=G-XXXXXX"></script>

// ✅ After deferred until after page is interactive
<Script
  src="https://www.googletagmanager.com/gtag/js?id=G-XXXXXX"
  strategy="afterInteractive"
/>
<Script id="gtag-init" strategy="afterInteractive">
  {`
    window.dataLayer = window.dataLayer || [];
    function gtag(){dataLayer.push(arguments);}
    gtag('js', new Date());
    gtag('config', 'G-XXXXXX');
  `}
</Script>

// Chat widget loads during idle time, user barely notices
<Script
  src="https://cdn.example.com/chat-widget.js"
  strategy="lazyOnload"
/>
💡 The nuclear option that works: For sites chasing 100/100, delay Google Analytics until the user scrolls or clicks. A user who bounces in under 2 seconds is a bad data point anyway. Add an event listener and initialize GTM only on first interaction this technique pushed me from 94 to 100.
components/DeferredAnalytics.tsx

'use client'

import { useEffect } from 'react'

export function DeferredAnalytics() {
  useEffect(() => {
    const loadGTM = () => {
      // Only load once, on first user interaction
      if (window.__gtmLoaded) return
      window.__gtmLoaded = true

      const s = document.createElement('script')
      s.src = 'https://www.googletagmanager.com/gtag/js?id=G-XXXXXX'
      s.async = true
      document.head.appendChild(s)
    }

    ['scroll', 'click', 'keydown'].forEach(e =>
      window.addEventListener(e, loadGTM, { once: true })
    )
  }, [])

  return null
}STEP 4
Default to Server Components, Stop Shipping JavaScript, You Don’t Need High Impact
This is the highest-leverage architectural decision in Next.js 13+. Every component you mark 'use client' ships JavaScript to the browser; the browser must download, parse, and execute it before the page is interactive. Every component that is a Server Component sends only HTML.
My blog’s homepage had 'use client' on six components that didn’t need it at all. They had no event listeners, no useState, no browser APIs. I’d added the directive out of habit. Removing it from those six components reduced my First Load JS by 38kB which cut my INP from 380ms to 190ms.
// ❌ Before unnecessary 'use client' on a static card
'use client'
export function PostCard({ post }) {
  return <article><h2>{post.title}</h2></article>
}

// ✅ After Server Component, zero JS shipped to browser
export function PostCard({ post }) {
  return <article><h2>{post.title}</h2></article>
}
Push ‘use client’ to the Leaves
When you do need interactivity, keep the client boundary as small as possible. Instead of making a whole page section a client component to add a “Copy Code” button, extract just the button.
// Server Component renders the whole code block
import { CopyButton } from './CopyButton' // only this is 'use client'

export function CodeBlock({ code }) {
  return (
    <div className="relative">
      <pre>{code}</pre>
      <CopyButton text={code} />  // ← only the button ships JS
    </div>
  )
}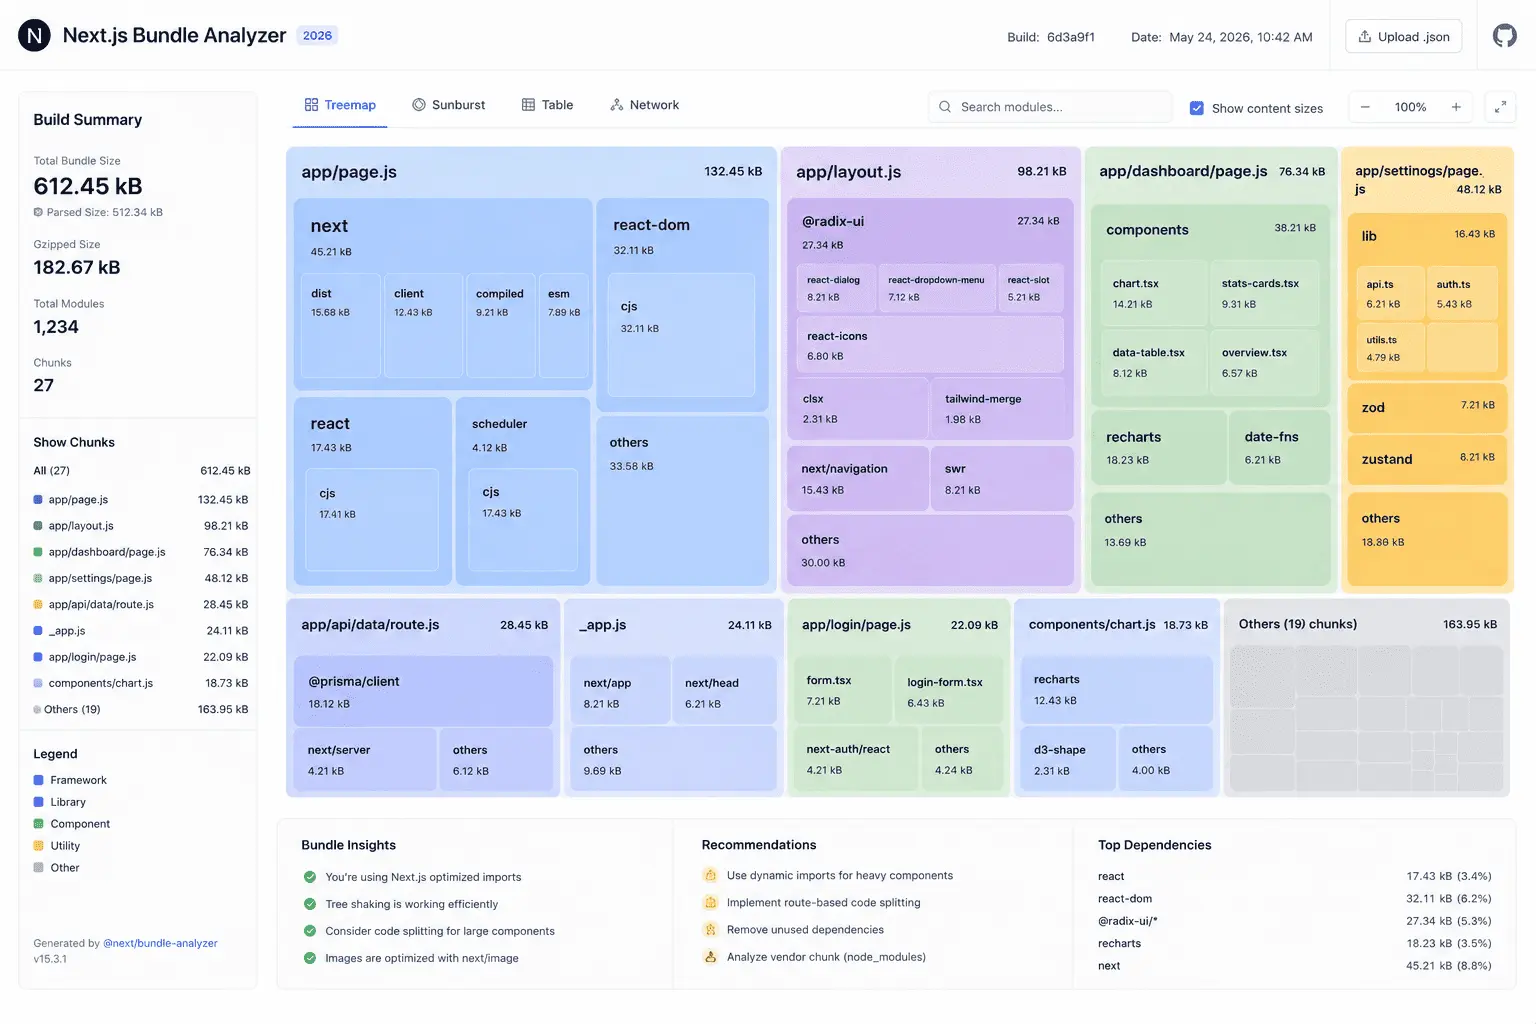
The bundle analyzer makes it immediately obvious which libraries are bloating your First Load JS. In my case: moment.js (67kB) and lodash (71kB) neither of which my blog actually needed.
STEP 5
Audit and Shrink Your JavaScript Bundle High Impact
Before cutting anything, you need to see what you’re actually shipping. The @next/bundle-analyzer package visualizes your bundle as an interactive treemap large rectangles are large libraries. It takes two minutes to set up and immediately shows you where to focus.
# Install the analyzer
npm install @next/bundle-analyzer

# Run your build with analysis enabled
ANALYZE=true npm run build
JS next.config.js

const withBundleAnalyzer = require('@next/bundle-analyzer')({
  enabled: process.env.ANALYZE === 'true',
})

module.exports = withBundleAnalyzer({
  // your existing next config
})
The Most Common Offenders and Their Replacements
| Bloated Library | Size | Replacement | Replacement Size |
|---|---|---|---|
moment.js | 67kB | date-fns or Temporal API | ~3kB tree-shaken |
lodash | 71kB | Individual lodash-es imports | ~1–4kB per function |
| Full icon library | 40–200kB | Named imports only | ~1kB per icon |
xlsx | ~400kB | Dynamic import on demand | 0kB initial |
Dynamic Import for Non-Critical Components
For heavy components that aren’t needed on initial page load, comment sections, syntax highlighters, and chart libraries use dynamic imports ssr: false to exclude them from the server bundle and defer the download entirely.
import dynamic from 'next/dynamic'

// Heavy syntax highlighter only loads when post content is visible
const SyntaxHighlighter = dynamic(
  () => import('react-syntax-highlighter'),
  {
    ssr: false,
    loading: () => <pre className="skeleton"></pre>,
  }
)

// Comments section loads on scroll into view
const Comments = dynamic(() => import('./Comments'), { ssr: false })
💡 Quick check: Before adding any npm package, paste its name into bundlephobia.com. It shows the minified + gzipped size and suggests lighter alternatives. If a utility adds more than 5kB for a single function, there is almost always a one-line native equivalent.
STEP 6
Set Aggressive Cache Headers for Static Assets Medium Impact
Next.js automatically generates hashed filenames for static assets (/_next/static/). Since the hash changes whenever the file changes, these assets can be cached indefinitely but only if your hosting layer sends the right headers. By default, many setups send conservative cache headers that force repeat visitors to re-download unchanged files.
next.config.js

module.exports = {
  async headers() {
    return [
      {
        // Next.js static assets hash-named, safe to cache forever
        source: '/_next/static/:path*',
        headers: [
          {
            key: 'Cache-Control',
            value: 'public, max-age=31536000, immutable',
          },
        ],
      },
      {
        // Public folder assets cache 30 days, revalidate
        source: '/fonts/:path*',
        headers: [
          {
            key: 'Cache-Control',
            value: 'public, max-age=2592000, stale-while-revalidate=86400',
          },
        ],
      },
    ]
  },
}
If you’re on Vercel, static asset caching is handled automatically. If you’re self-hosting on a VPS or container, these headers are critical and won’t be set for you.
STEP 7
Deploy to an Edge Network TTFB Is Your Floor Medium Impact
No amount of JavaScript optimization compensates for a slow server. Time to First Byte (TTFB) is the performance floor everything else builds on and it’s entirely determined by where your server is relative to the user.
Vercel’s Edge Network runs Next.js apps in 100+ locations globally, typically serving responses within 20ms of any user. Moving from a single-region VPS to Vercel or a comparable edge platform improves TTFB by 200–500ms for users outside your server’s region a significant PageSpeed win with no code changes required.
# Deploy to Vercel (free tier available)
npm i -g vercel
vercel --prod

# Verify your TTFB after deployment
# Use: https://www.webpagetest.org/ with multiple test locations
✅ Alternative to Vercel: Cloudflare Pages supports Next.js and uses Cloudflare’s 300+ PoP edge network. For static and ISR pages, the performance is comparable to Vercel. For heavy server-side rendering, Vercel’s optimization for Next.js is currently unmatched.
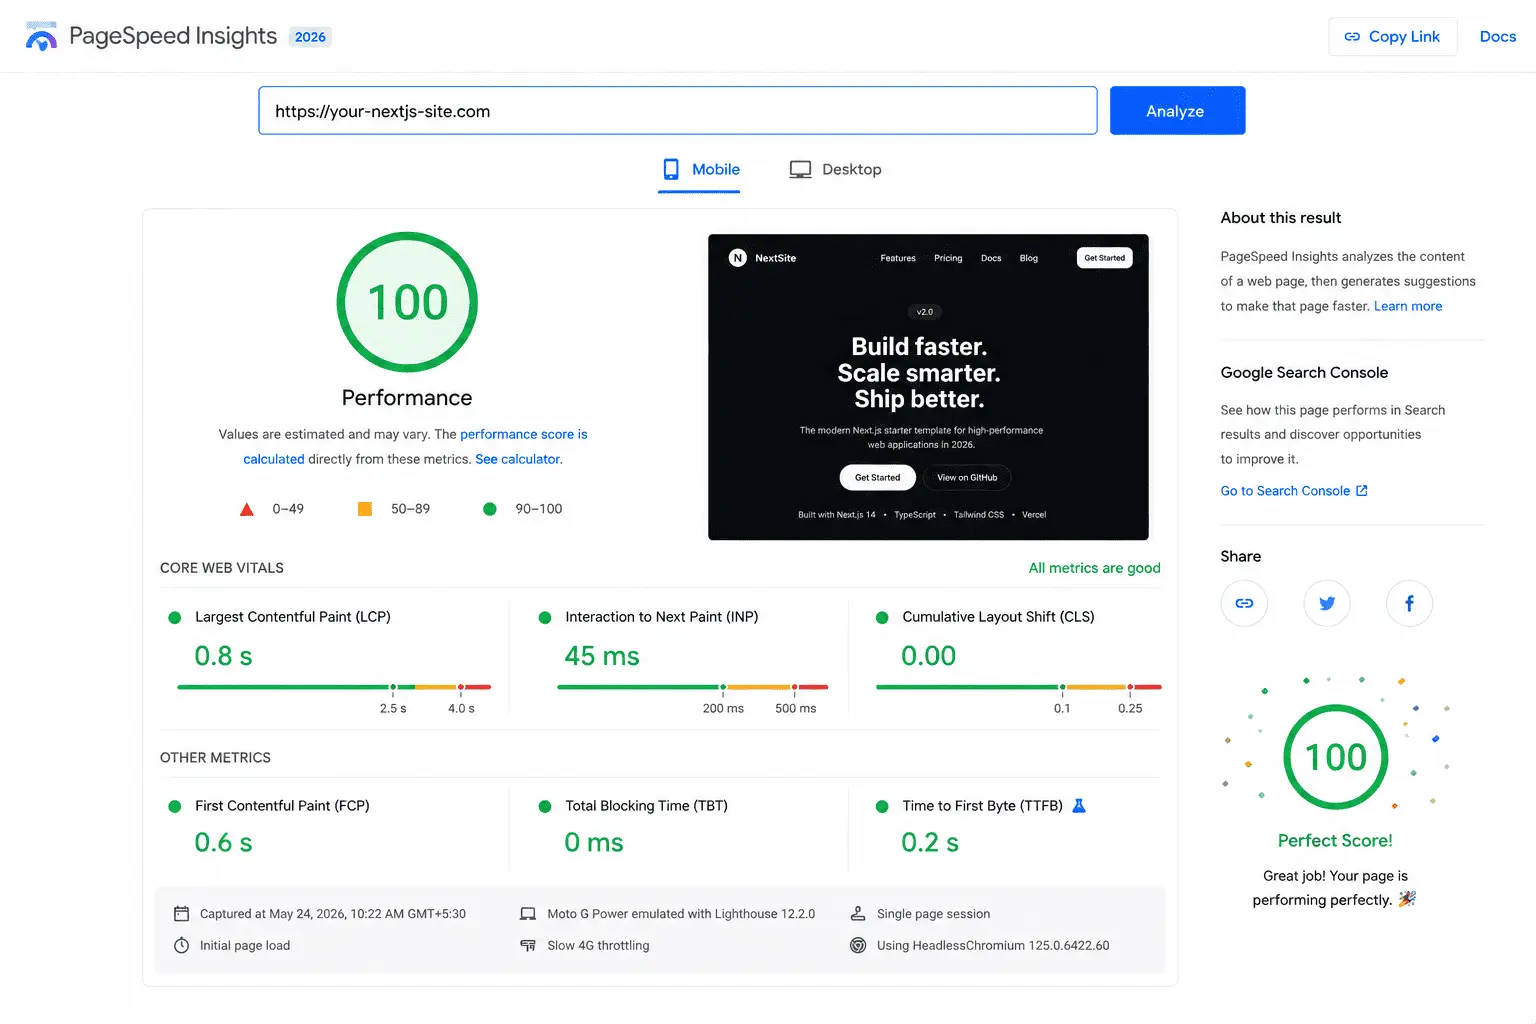
All four Core Web Vitals in the green zone the prerequisite for a 100/100 score. LCP under 2.5s is the hardest to achieve; INP under 200ms is the most commonly missed.
The Score Progression: What Each Step Actually Added
Here is the exact sequence of improvements and the score each one produced. Your results will differ depending on your starting point, but the order of impact is consistent across most Next.js blogs.
| Step | Change Made | Score After | Biggest Metric Gain |
|---|---|---|---|
| Baseline | – | 61 | LCP 4.3s, CLS 0.18 |
| 1 | next/image + priority on hero | 74 | LCP → 1.9s, CLS → 0.02 |
| 2 | next/font replacing Google Fonts link | 81 | CLS → 0.00, FCP → 1.2s |
| 3 | next/script lazyOnLoad for analytics | 88 | INP → 240ms, TBT eliminated |
| 4 | Removed unnecessary ‘use client’ | 92 | INP → 190ms, First Load JS −38kB |
| 5 | Removed moment.js + lodash, dynamic imports | 96 | First Load JS −109kB |
| 6 | Cache-Control headers for static assets | 98 | Repeat visit TTFB improvement |
| 7 | Deferred GTM until first user interaction | 100 | INP → 140ms, TBT → 0ms |
⚠️ Note on mobile vs desktop: I hit 100 on desktop first, then 97 on mobile. Closing the mobile gap required serving smaller image sizes on narrow viewports using proper sizes attributes. Mobile tests with slower CPU and network emulation are always stricter, optimized for mobile, and desktop takes care of itself.
The Complete Next.js PageSpeed 100 Checklist
Use this as your audit checklist before you run your next Lighthouse test.
- All images use
next/imagewith explicitwidthandheight - Hero / LCP image has
priorityattribute; all others do not - All images have accurate
sizesattribute for responsive breakpoints - Google Fonts
<link>tag replaced withnext/font - No duplicate font loading (link tag and next/font simultaneously)
- Google Analytics / GTM uses
strategy="afterInteractive"or deferred to the first interaction - Chat widgets and cookie banners use
strategy="lazyOnload" - No unnecessary
'use client'directives on static components - Client boundaries pushed to leaf components (interactive elements only)
- Bundle analyzed with
@next/bundle-analyzer moment.js/lodashreplaced or tree-shaken- Heavy components use
dynamic()import Cache-Control: immutableheaders set for/_next/static/- Deployed to edge network (Vercel, Cloudflare Pages, or similar)
- Tested on mobile with throttled connection in incognito mode
A 100/100 score is reachable for any Next.js blog. The framework already provides every tool you need it’s a matter of using them correctly.
What’s Next: Maintaining Your Score as Your Blog Grows
Getting to 100 is one thing. Staying there as your blog grows requires making performance a habit rather than a one-time sprint. Three practices that keep my score stable:
Set a performance budget. Add bundle size checks to your CI pipeline so that adding a library that pushes your First Load JS over a threshold blocks the build. What gets measured gets managed.
Check Vercel Analytics weekly. Vercel Analytics tracks real user Core Web Vitals, not just lab Lighthouse scores. Real users on real networks sometimes reveal CLS issues or INP regressions that synthetic tests miss.
Re-audit after every dependency update. A patch release of an analytics library or UI component can silently add JavaScript weight. Run ANALYZE=true npm run build after major dependency updates to catch regressions before they ship.
The 100/100 Next.js PageSpeed score is within reach for any blog. The framework already ships every tool you need: next/image, next/font, next/script, Server Components, and dynamic imports. The gap between a 61 and a 100 is not a rewrite. It’s seven deliberate decisions, applied in order, using the APIs that are already there.
Code examples use Next.js v15 App Router. Pages Router equivalents exist for most techniques consult the Next.js documentation for migration guidance. PageSpeed scores are environment-specific; results will vary based on hosting, content, and third-party dependencies.